Stock
11-03-2024 19:02
2073 Views
Has the Bearish Engulfing Pattern Sealed NVDA’s Fate at the Top?
The Bearish Engulfing Pattern Marks a Top for NVDA
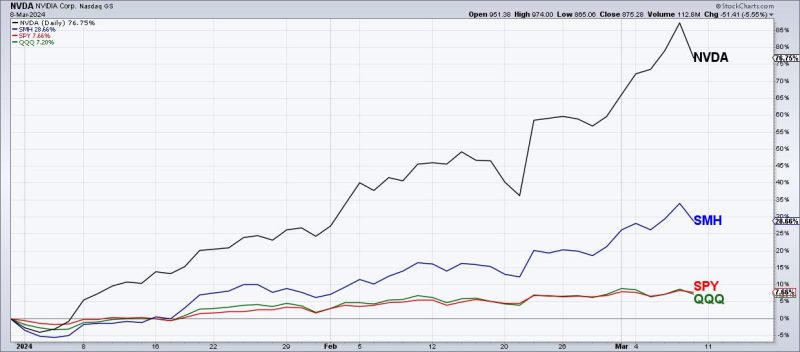
Nvidia Corporation (NVDA), a leading technology company known for its graphics processing units (GPUs) and artificial intelligence solutions, has recently seen a significant bearish engulfing pattern emerge on its price chart. The bearish engulfing pattern is a popular candlestick chart pattern that often signifies a potential top or reversal in a stock's price trend.
A bearish engulfing pattern forms when a bullish candle is followed by a larger bearish candle that completely engulfs the previous candle. This pattern indicates a shift in market sentiment from bullish to bearish, with the larger bearish candle overpowering the smaller bullish candle.
In the case of NVDA, the bearish engulfing pattern suggests that the stock may have reached a top and could be poised for a downward move in the near future. Traders and investors who closely follow technical analysis may view this pattern as a warning sign to consider reducing their holdings or potentially initiating short positions to profit from a potential decline in NVDA's stock price.
It is important to note that while the bearish engulfing pattern can be a reliable indicator of a upcoming decline, it is not foolproof and should be used in conjunction with other technical analysis tools and indicators to confirm the signal. Furthermore, market conditions and external factors can also impact the stock's price movement, so it is essential for investors to conduct thorough research and analysis before making any trading decisions based on a single pattern.
In conclusion, the emergence of a bearish engulfing pattern on NVDA's price chart is a significant development that suggests a potential top or reversal in the stock's price trend. Traders and investors should closely monitor NVDA's price action in the coming days and weeks to see if the bearish signal plays out as expected.